Measuring Power Grid Interference in Practice
Would you like to know what interference occurs in the power grid? Why deal with filtration? To illustrate the issue, I made measurements at four different places. For comparison, I used a common EURO cable and RD Power Filter.
What Are We Measuring and What With
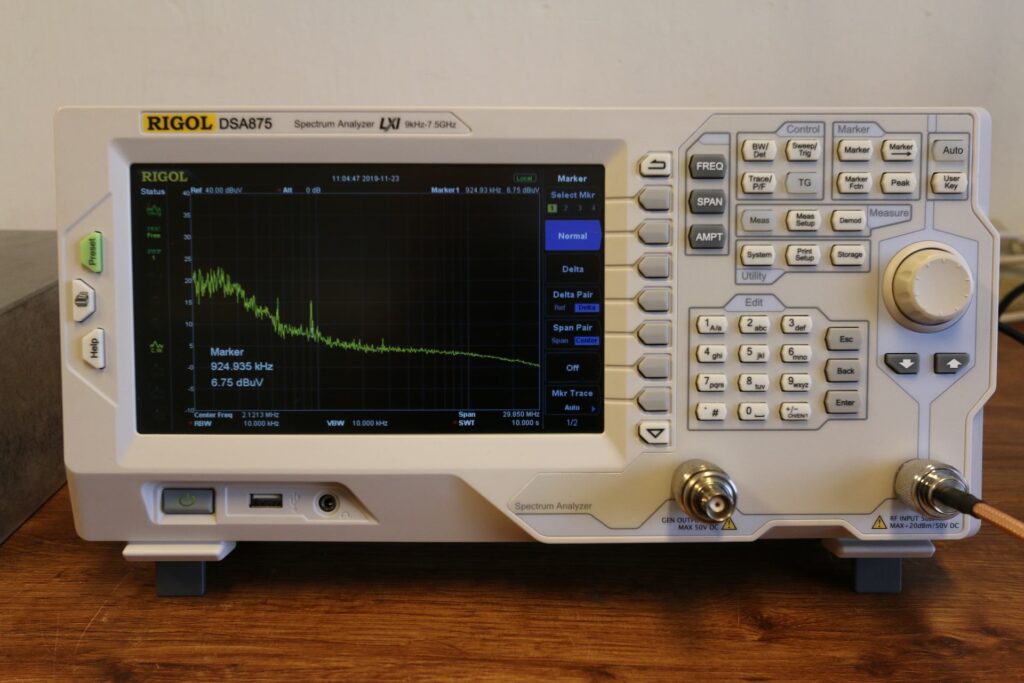
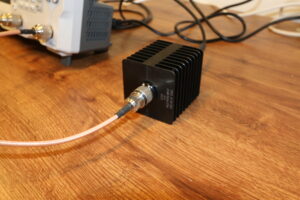
We are going to measure the high frequency component in the power grid between the phase and the PE protective conductor. The voltage going to the measuring kit is conducted by a common EURO cable and the RD Power Filter in order to compare their efficiency. For the measurements, we are going to use a Rigol DSA875 spectrum analyzer. We have a 20dB attenuator in the path to prevent damage to the sensitive input of the analyzer. The last part of the measuring chain is HF isolation.
Why should we care about high frequencies at all?
We hear only up to 20 kHz… Yes, this is true, however, on these high (or carrier) frequencies, low frequencies can be modulated, and we can hear those. The principle of amplitude modulation where low frequency signal is modulated on a high frequency was utilised by the first radios more than a hundred years ago and is still used today. High frequency interference goes through the power source parts very easily and can cause oscillation when it reaches sensitive input circuits of an amplifier, phonograph pre-amp, DA converter, etc. You can read more on amplitude modulation here, for example.
RDacoustic Listening Room
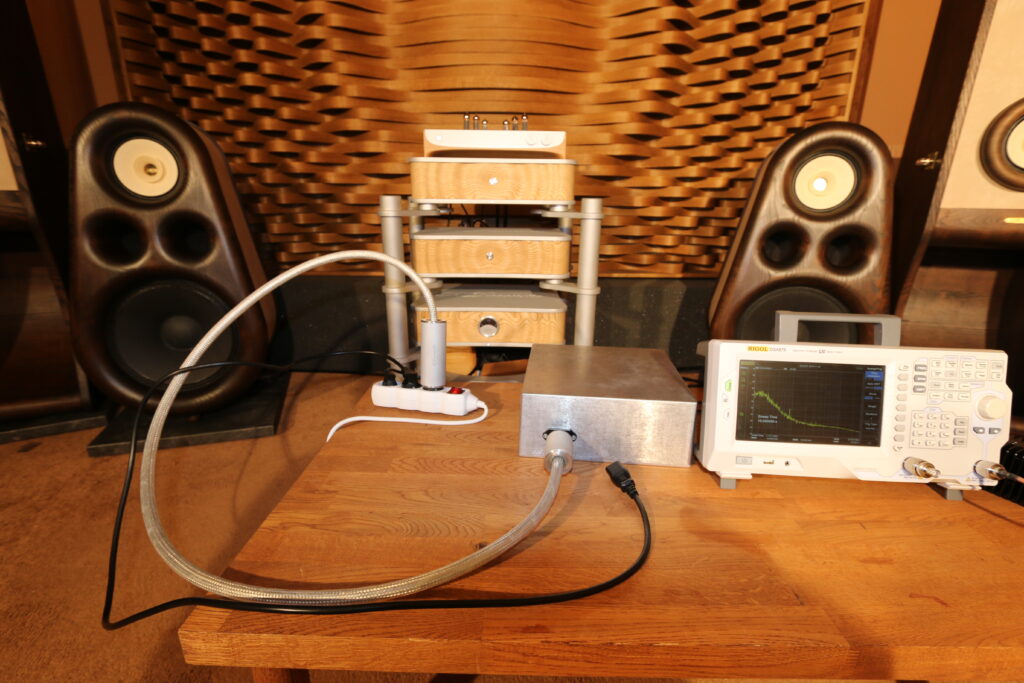
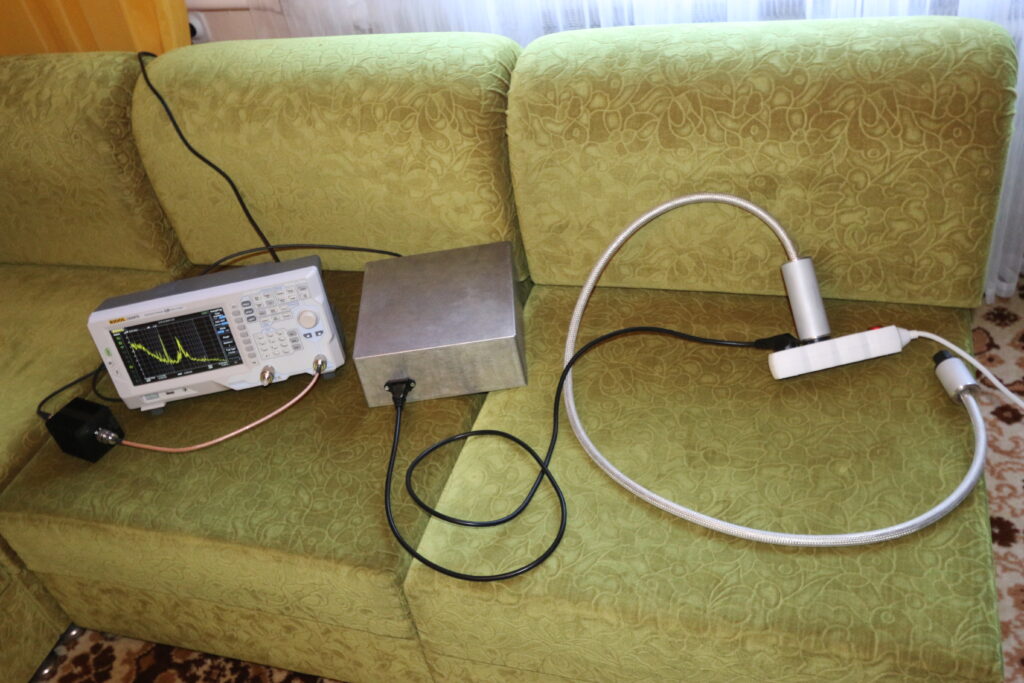
Measuring system configuration: A 3m extension cord leads from the wall power socket. One of the extension cable outlets serves as a connection for a 1,5m EURO cable, another one for an RD Power Filter of the same length; both having the same starting point. The spectrum analyzer is powered from the same place.
The amplitude range is set to 65 dBuV, 150 kHz to 30 MHz. VoltageAVG sampling (that is the arithmetic mean of all values), 10 s measuring time.
First, I go with the EURO cable which transfers all high frequency components into the measuring kit. Behold what we have in the grid in our listening room… 🙂 The peak (1) is 79.59 dBuV (we have to add 20 dB for the attenuator) on the 472.7 kHz frequency, which is 28 dBuV more than the standard allows for! (We wrote more about EMC and related standards here.) We cannot easily find out where this interference comes from; perhaps our neighbour’s heat pump, a charger with bad interference suppression, or a kitchen blender. We do not wish to look for the perpetrators here, but rather to show that today, there really is a lot of high frequency interference in the grid. Proportionately, the more appliances with switched-mode power supplies, frequency converters, commutator motors and so on, the more interference there is in the grid which powers these appliances. How do we deal with this?
I have exchanged the EURO cable for our filter. The decrease in interference is significant, on the 472.7 Hz frequency where the peak was, the interference went down by 35.5 dBuV.
Background
With the input of the spectrum analyzer disconnected, I measure the background. By background we mean a notional zero, from which all deviations in the measured frequency spectrum recede. As you can see, the background is not a straight line. We will take its shape for a reference zero with all other measurements.

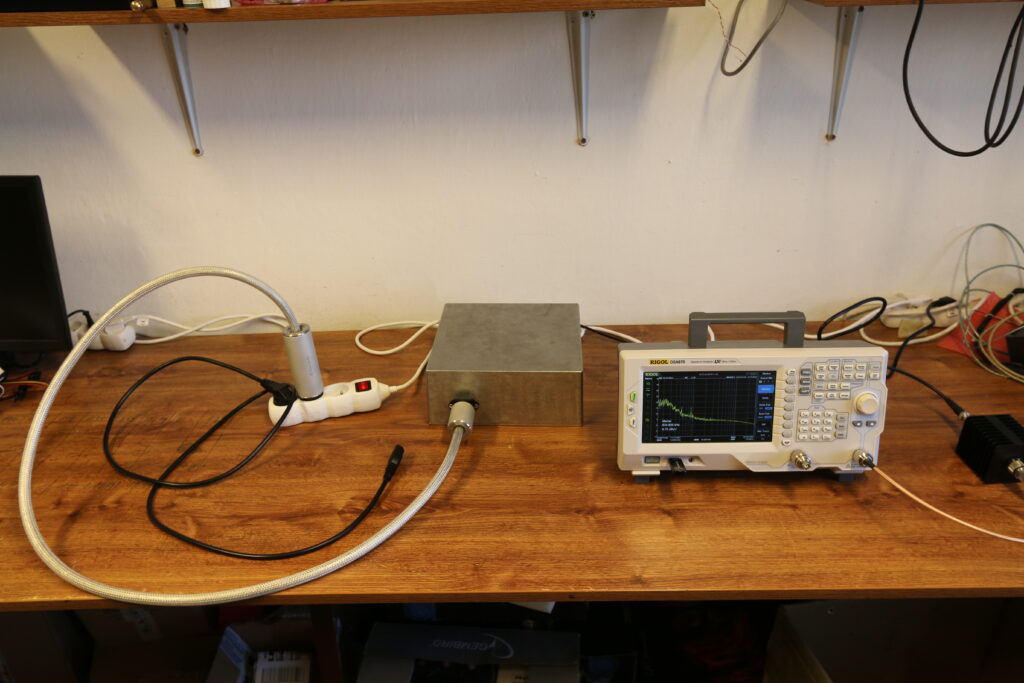
Workshop
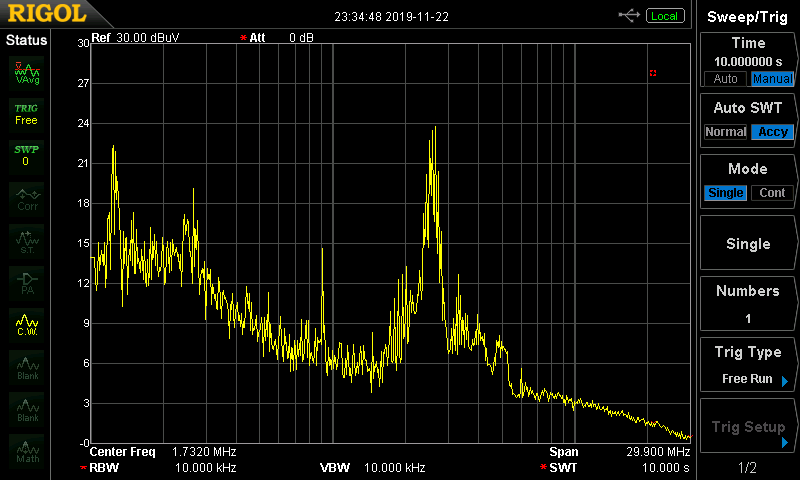
Measurements done with the same configuration.
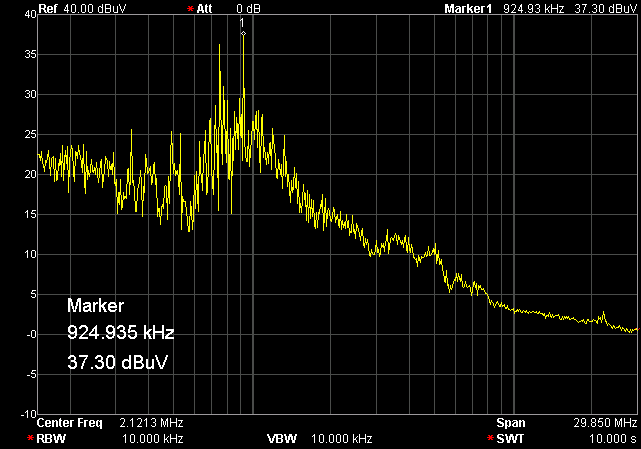
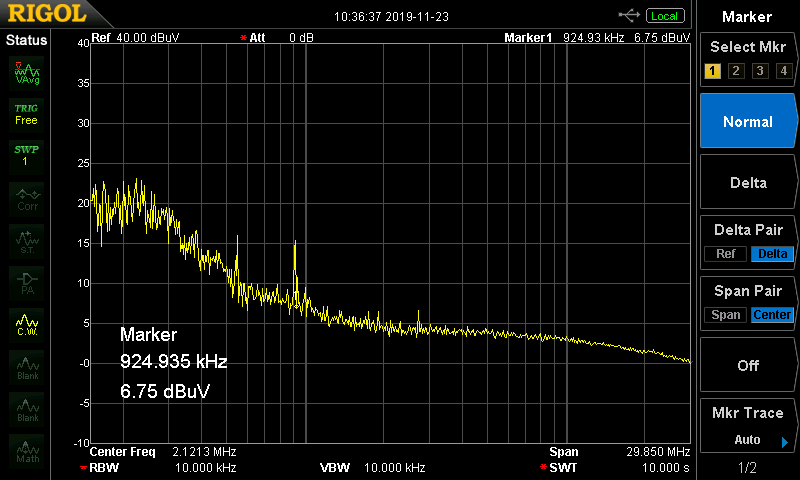
EURO cable: The peak in the grid is on 924.9 kHz, its real size is 57.3 dBuV, which is again approx. 8 dBuV more than what is allowed.
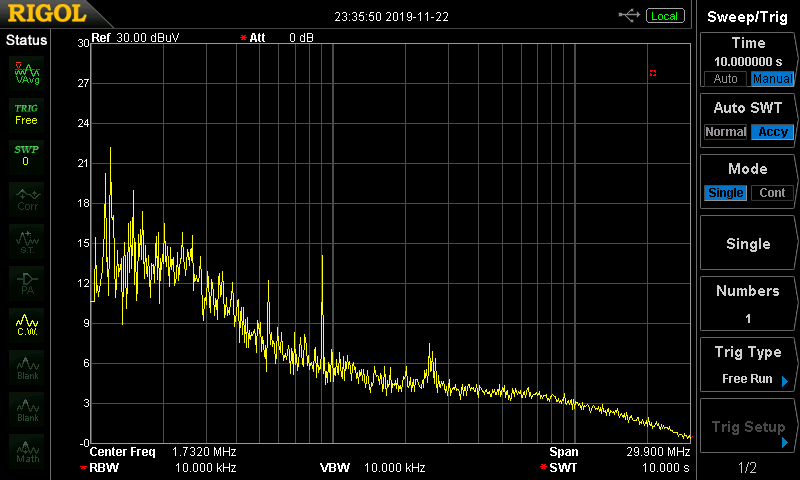
Connecting with the filter, the entire interference spectrum is reduced, say by up to 10 MHz. We cannot see higher frequencies in the left nor the right image.
Grandma’s House
Same configuration once again
Here, we can recognise two peaks standing out from the background. Going with the filter, both are significantly reduced. The peak on the left (966.7 Hz) went from the amplitude of 44.7 dBuV to the level of the background (28 dBuV). That may seem as nothing at first glance, but dBuV is a logarithmic axis.
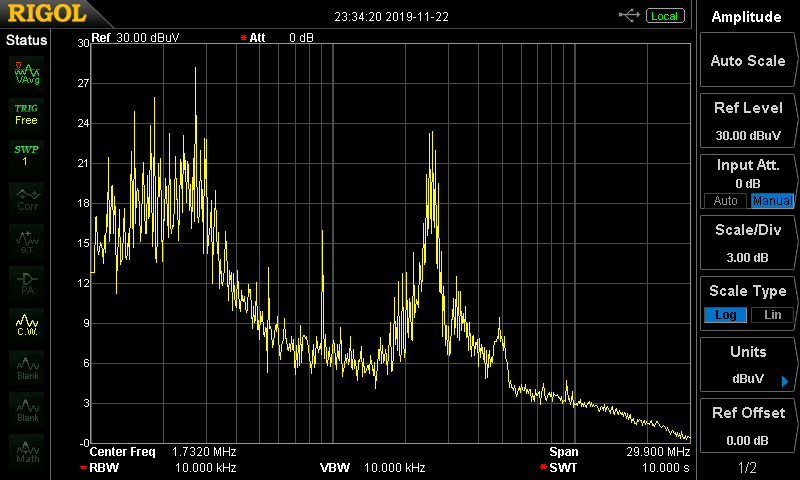
The peak on the right on 2.4 MHz has been eliminated completely.
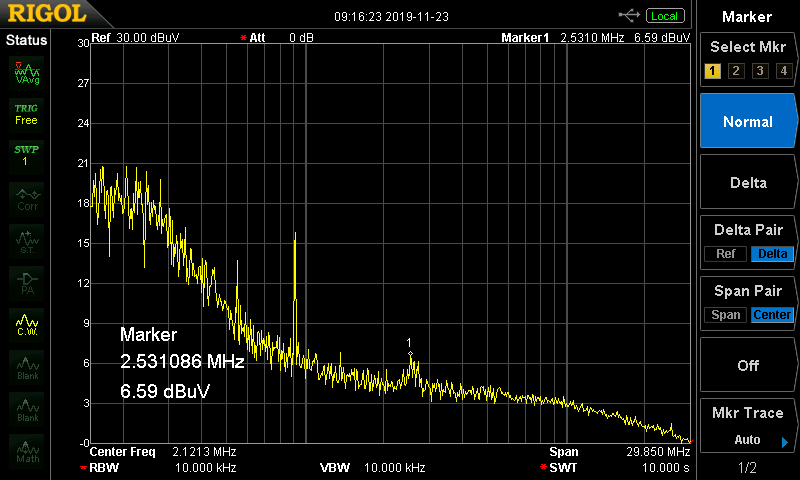
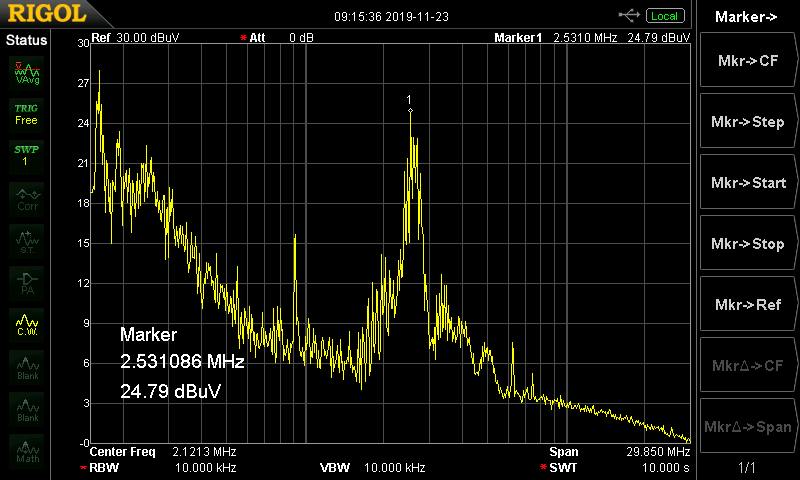
At Home
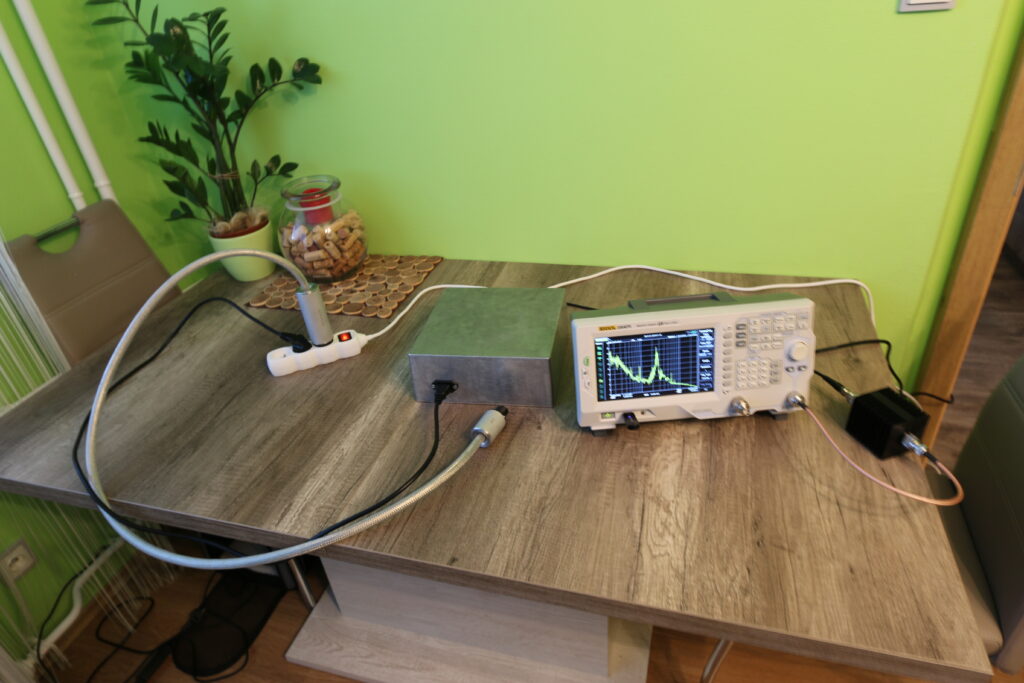
The configuration is once again the same, powered by a standard power socket.
The largest interference now occurs on frequencies around 2.53 MHz. With the filter, the peak of 44.8 dBuV has gone almost to the level of the background, to 26.6 dBuV.
To Conclude
All the measurements were done on a quiet Saturday morning on 23/11/2019 in Rožnov pod Radhoštěm, aside from industrial locations.
At each place, the interference peak was on a different frequency. The character and size of interference is therefore dependent not only on the quality of your own appliances, but more so on what your neighbours and neighbours’ neighbours use. We all get interference in the grid once anybody uses an appliance with poor interference protection in the rather large area around us that uses a single transformer station. This would not matter as much in a household. Audio appliances, however, are very susceptible to high frequency interference, and so quality filtration is considered to be a cornerstone of any audio system.
Finally, let us point out that when it comes to our own filter, it does not deal with high frequency interference only; it also serves as a perfect complex surge protection. You can read more about that on the product page.
![]()
Limits of interference variables according to EN 50081-1
| Device input (measured quantity) |
Frequency range | Limits | |
|---|---|---|---|
| Housing (radiation field, 10m distance) |
30 ÷ 230 MHz | 30 dBmV/m | |
| 230 ÷ 1000 MHz | 37 dBmV/m | ||
| Signal, control, power terminals (continuous voltage) |
0.15 ÷ 0.5 MHz | QP value | AV value |
| 66 ÷ 56 dBmV | 56 ÷ 46 dBmV | ||
| 0.5 ÷ 5 MHz | 56 dBmV | 46 dBmV | |
| 5 ÷ 30 MHz | 60 dBmV | 50 dBmV | |
| Signal, control, power terminals (interference current) |
0.15 ÷ 0.5 MHz | 40 ÷ 30 dBmA | 30 ÷ 20 dBmA |
| 0.5 ÷ 30 MHz | 30 dBmA | 20 dBmA | |
Newsletter
We'll let you know about our participation in audio shows, new reviews and products, new places to listen to your speakers, or new posts on our blog. We won't spam you.